| Did you know ... | Search Documentation: |
| Visualizing profiling data |
- HOME
- DOWNLOAD
- DOCUMENTATION
- TUTORIALS
- Beginner▶
- Advanced▶
- Web applications▶
- Semantic web▶
- Graphics▶
- Machine learning▶
- External collections▶
- For packagers▶
- COMMUNITY
- COMMERCIAL
- WIKI
4.42.2 Visualizing profiling data
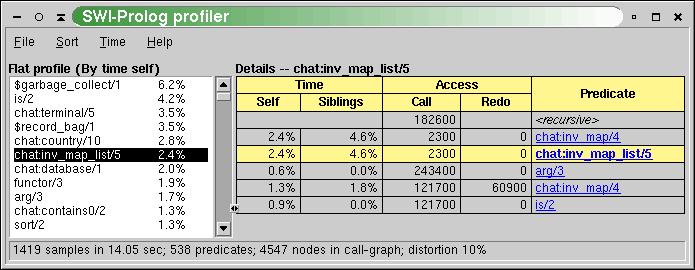
Browsing the annotated call-tree as described in section 4.42.3 itself is not very attractive. Therefore, the results are combined per predicate, collecting all callers and callees as well as the propagation of time and activations in both directions. Figure 4 illustrates this. The central yellowish line is the‘current’predicate with counts for time spent in the predicate (`Self’), time spent in its children (`Siblings’), activations through the call and redo ports. Above that are the callers. Here, the two time fields indicate how much time is spent serving each of the callers. The columns sum to the time in the yellowish line. The caller <recursive> is the number of recursive calls. Below the yellowish lines are the callees, with the time spent in the callee itself for serving the current predicate and the time spent in the callees of the callee ('Siblings’), so the whole time-block adds up to the‘Siblings’field of the current predicate. The‘Access’fields show how many times the current predicate accesses each of the callees.
The predicates have a menu that allows changing the view of the detail window to the given caller or callee, showing the documentation (if it is a built-in) and/or jumping to the source.

The statistics shown in the report field of figure 4 show the following information:
- samples
Number of times the call-tree was sampled for collecting time statistics. On most hardware, the resolution ofSIGPROFis 1/100 second. This number must be sufficiently large to get reliable timing figures. The Time menu allows viewing time as samples, relative time or absolute time. - sec
Total user CPU time with the profiler active. - predicates
Total count of predicates that have been called at least one time during the profile. - nodes
Number of nodes in the call-tree. - distortion
How much of the time is spent building the call-tree as a percentage of the total execution time. Timing samples while the profiler is building the call-tree are not added to the call-tree.